
by Sabine Golombek and Michael Blanke
Background
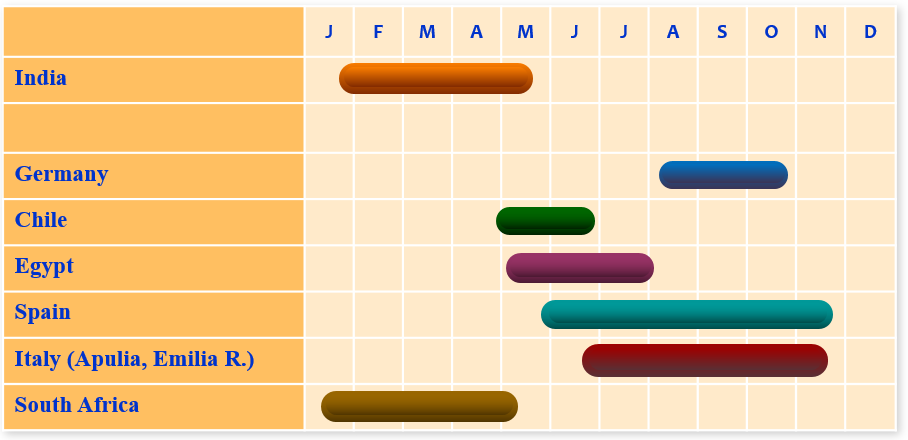
India and South Africa supply table grapes to Europe during the winter months from January to April (Figure 1), a time when European table grapes are not yet available.
The awareness of sustainability and the demand for environmental-friendly products are growing. This trend also challenges the grape industry to determine the benefits and burdens for the environment from planting the grapevines in the vineyard to export and distribution. Carbon footprinting is such a suitable tool to quantify such environmental impact by identifying and quantifying the involved greenhouse gas (GHG) emissions.
Our study
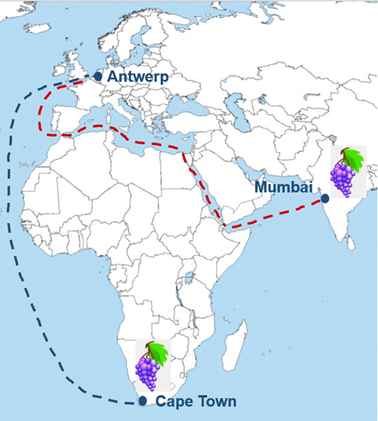
In our study, we examined the carbon footprint of the whole transport chain from harvesting the table grape in Solapur on the Western coast of India to the consumption; the study excludes the grapevine cultivation.
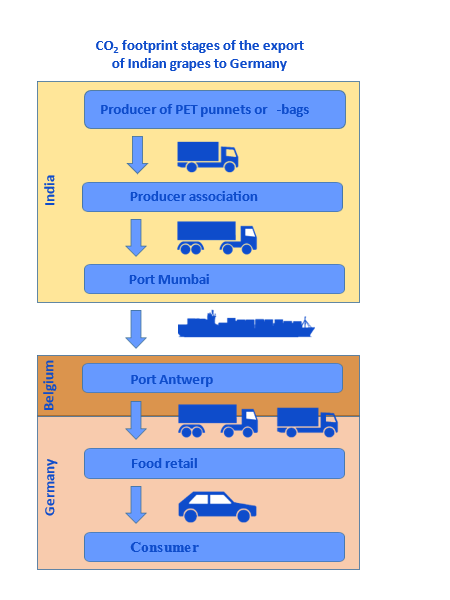
Our carbon footprint study was based on the PAS 2050-1 guideline, which was developed for horticultural products and grapes, from the British Standards Institute (BSI) in London. A 500 g punnet table grapes was used as reference and all cooling, packaging, transport etc. processes converted into CO2-equivalents.
The hotspots
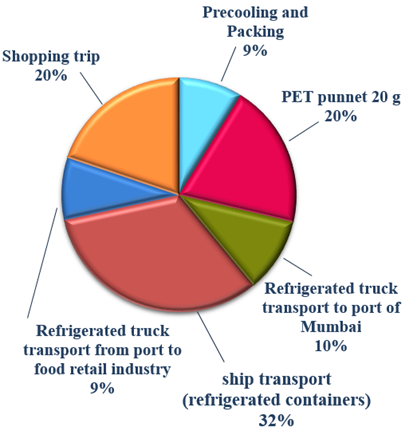
The largest carbon emissions (32%) were assigned to the ship transport from Mumbai to Antwerp, as expected. The production of the PET punnet in India (20%) and, to our surprise, the consumer shopping trip to purchase the table grapes in the retail store in Europe were identified as the second largest carbon emission hotspots (also ca. 20%) with almost similar values. These carbon emissions of the consumer shopping trip with a fossil fuel powered car were calculated for a 20 kg supermarket purchase including 500 g grapes.
Precooling together with packing and the refrigerated truck transports from the vineyard to the port of Mumbai (10%) as well as from the port of Antwerp to the retail shop (9%) generated the fourth largest, emission.
For more sustainable and environmental-friendly table grapes – carbon reduction potentials:
- The exporters could improve the carbon footprint by using lightweight plastic shells or seals or different packaging materials, which are transparent PE bags or cardboard
- To our surprise, the consumers had a significant share (20%) in the carbon footprint of the table grapes they consume (Figure 4). Hence, major a carbon reduction could be achieved by shopping with fuel saving cars, vehicles with hybrid or electric power, car share or use of environmental-friendly transport means such as public transport or bicycle.
Read more under:


INRES – Hort Science, University of Bonn, Germany
sabine.golombek@gmx.de, mmblanke@uni-bonn.de
Sabine Golombek studied agriculture and gained her PhD from the Technical University at Berlin. As a post-doc, she gained experience in carbon footprint, LCA and sustainability issues under the supervision of Michael Blanke.