By Natalia Brossard, Beatriz Gonzalez-Muñoz, Carolina Pavez, Arianna Ricci, Xinmiao Wang, Fernando Osorio, Edmundo Bordeu, Giuseppina Paola Parpinello, Jianshe Chen
Astringency may be described as the dry, rough, and puckering sensation experienced in the mouth and is it perceived as an increase of frictional forces between surfaces within the oral cavity (Upadhyay et al., 2016). In enology, astringency is a crucial sensory attribute that contributes to mouthfeel of red wines, and it is a significant contributor to consumer acceptance (Basalekou et al., 2019; Bajec and Pickering, 2008; Gawel 1998). During ripening, the reduction of the drying astringency found in immature grapes is expected (Rousseau and Delteil 2000). However, the real influence of ripeness on astringency is still not completely clear.
Astringency can be estimated by analytical methods based on tannin concentration. However, the conventional analytical methods are indirect and don’t allow an accurate prediction of astringency (Llaudy et al., 2004; Kennedy et al., 2006; Sáenz-Navajas et al., 2010; Sáenz-Navajas et al., 2019).
Oral lubrication studies (friction coefficient) have emerged as a possible tool to estimate astringency (Prakash et al., 2013; Brossard et al., 2016; Upadhyay et al., 2016). Results obtained have contributed to important advances in trying to mimic oral conditions and astringency determination by lubrication tests (Brossard et al., 2016). However, these results revealed complex and specific interactions between tannins and saliva proteins with or without the precipitation of the complex (Cala et al., 2012; Rossetti et al., 2009; Brossard et al., 2016).
Based on this, this work explores the changes in astringency during grape ripening based on the evolution of both wine analytical parameters and changes in the aggregates produced by red wine tannins and saliva proteins. Red wines of Cabernet Sauvignon and Carménère cultivars, with similar tannin content but different astringency sub-quality (rough and soft/velvety, respectively) (Brossard et al., 2016; Fernandez et al., 2007), were evaluated. Astringency was characterized in terms of friction coefficient of wine/saliva mixture, polyphenol content, sensory analysis and tannin/salivary-proteins aggregates characterization (Particle size distribution; Zeta-potential; Morphology analysis of saliva and wine mixtures by light microscopy (LM) and scanning electron microscopy (SEM)).
Harvest was carried out at four dates representing different phenolic ripeness stages: i) grape grower traditional harvest (GTH) defined by the grape grower based on composition (13 – 14 % v/v of potential alcohol, titratable acidity 3.5 to 4.5 g/L H2SO4) and grape tasting, ii) one month before GTH (GTH-1m), iii) 15 days before GTH (GTH-15d) and iv) 15 days after GTH (GTH+15d; only for Cabernet Sauvignon).
Results of this work showna different evolution during ripening was found for both Cabernet Sauvignon and Carménère, and tannin-protein aggregates showed differences in size, shape and surface. Specifically, Cabernet Sauvignon showed a significant decrease in the friction coefficient as ripeness increases, while Carménère had a significant increase.
Interestingly, a different behaviour was obtained for the centrifuged samples. An increase of friction coefficient with ripening was obtained for both Cabernet Sauvignon and Carménère wines. Although the precipitates obtained (Table 2) also showed significant differences in weight (P=0.0001), these results didn’t show a similar pattern as the friction results for non-centrifuged samples. These differences in friction coefficient for wine:saliva mixtures suggest a role of non-precipitated or soluble aggregates (Brossard et al. 2016; Ma et al. 2014; Schwarz and Hofmann 2008; de Wijk and Prinz 2005; de Freitas and Mateus 2001; Kallithraka et al. 2001).
When comparing the lubrication results of non-centrifugated mixtures to control samples (Table 2), GTH-1m (first harvest date Cabernet Sauvignon) – with lower tannin content (Table 1) – produces a high friction coefficient similar to water; while GTH+15d (last harvest date Cabernet Sauvignon) – with a higher tannin content (Table 1) – produces a lower friction coefficient more similar to saliva. On the other hand, for Carmenère the first two dates showed friction coefficients similar to saliva even with high tannin contents (Table 1). These results suggest that the friction coefficient seems to be neither simply nor directly related to tannin content, and tannin-protein soluble and insoluble aggregates could be responsible for oral lubrication modulation.
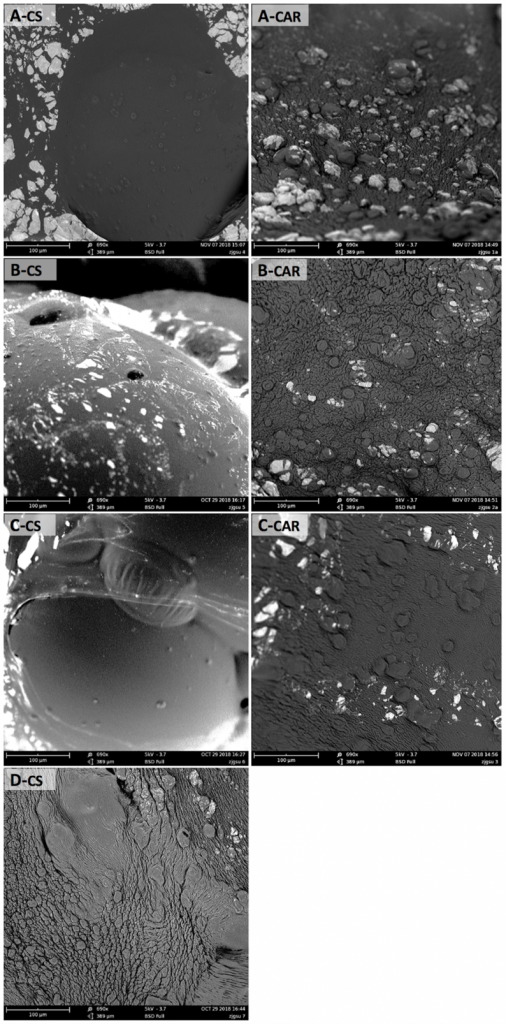
Further examination of aggregates surface under SEM (Figure 1), reveals very different surface characteristics for both varieties. The aggregates of Cabernet Sauvignon show a smoother surface, with small granules (serrated and globular) on their surface, except for the fourth harvest date (GTH+15d) that presents aggregates more similar to Carménère. On the contrary, Carménère aggregates surface seems rougher and uneven in texture, with small spheres that protrude from their surface (flatted and globular).
The correlations suggest an important role of both tannin content and aggregates on both astringency perception and oral lubrication. Also, it is possible to observe a common pattern that inversely relate both roundness and Feret diameter of aggregates to the coefficient of friction. When comparing Carménère, usually described with a velvety astringency but that showed a high astringency intensity (Table 3), the amount of precipitated aggregates is significantly lower than in Cabernet Sauvignon (Table 2). This suggests that the aggregates could have the capacity of modulating the perceived astringency (intensity and sub-quality) in function of their amount and surface characteristics. This might imply that astringency intensity could be related to the number of aggregates present in mouth (Figure 2-A), and the astringency sub-quality could be related to the characteristics of aggregates themselves (Figure 2-B), as proposed in Figure 2.
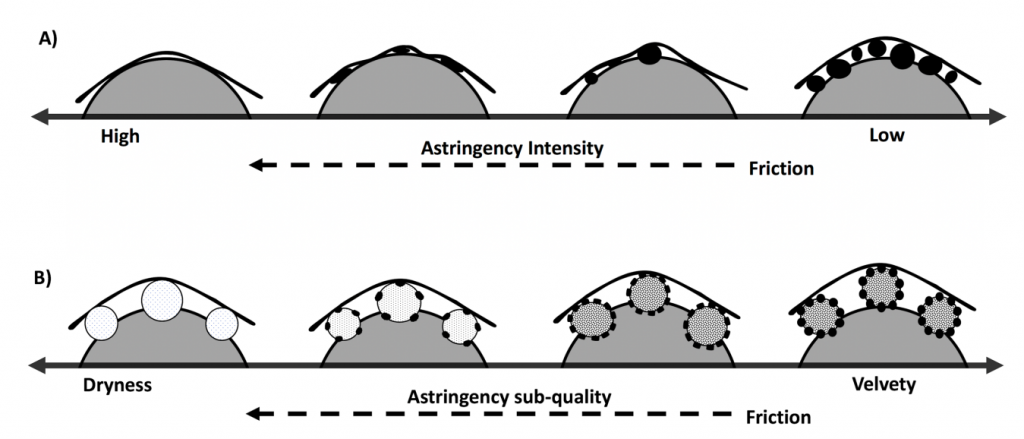
Results from this work on the friction coefficient suggest that both soluble and insoluble aggregates could be responsible for oral lubrication modulation. Here we propose a mechanism for astringency intensity and its sub-qualities that illustrates the role of the aggregates. The model for astringency sub-qualities takes into consideration not only the presence of the particles, but also their shape, size and texture. These aggregates could be sensed as velvety or harsh depending on their effect on the friction coefficient (Figure 2). Findings of this work reveal a complex ripening evolution that can lead to opposite sub-qualities. However, other variables such as anthocyanins and tannin mDP also need to be taken into consideration in future studies to better explain the differences between Cabernet Sauvignon and Carménère wines.
The full publication can be found as:
Brossard, N.*, González-Muñoz, B., A. Ricci, F. Osorio, E. Bordeu, G.P. Parpinello, J. Chen. (2021). Astringency sub-qualities of red wines and the influence of wine-saliva aggregates. International Journal of Food Science & Technology. DOI: 10.1111/ijfs.15065
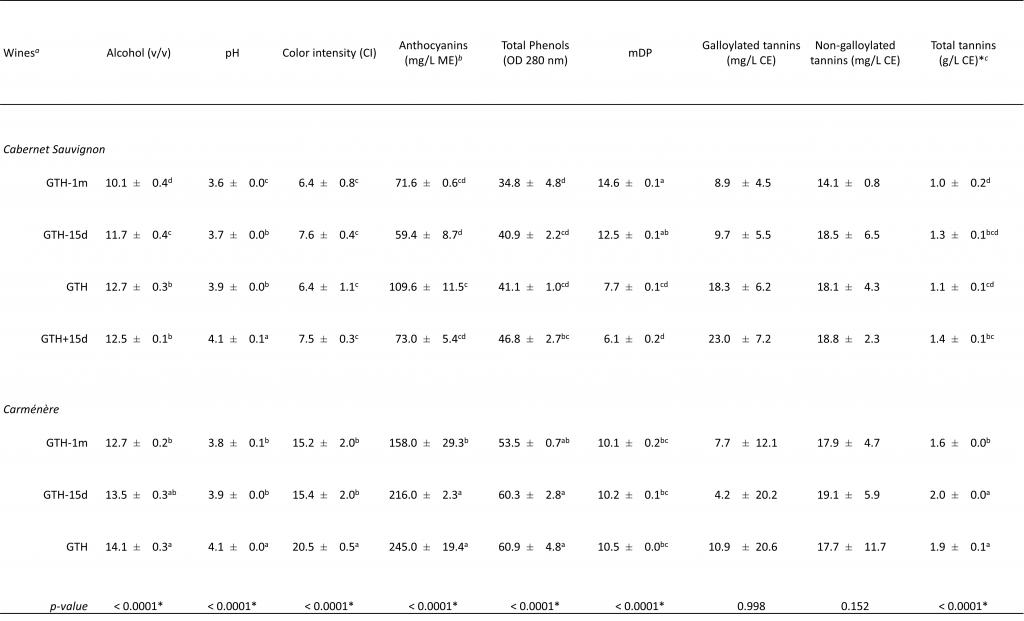
Different letters indicate a significant difference at p<0.05 between wines and harvest dates treatments calculated by Tukey Means Comparison Method.
a Wines produced at different harvest dates: 1) one month before of grape-grower traditional harvest (GTH-1m), 2) 15 days before (GTH-15d), 3) traditional harvest defined by the grape-grower (GTH), and 4) 15 days after (GTH+15d).
b Milligrams by liter expressed in malvidin equivalent (ME), determined by HPLC-DAD
c Milligrams by liter expressed in catechin equivalent (CE), determined by HPLC-DAD
Total tannins also include Procyanidin B2 and Polymer-Adducts
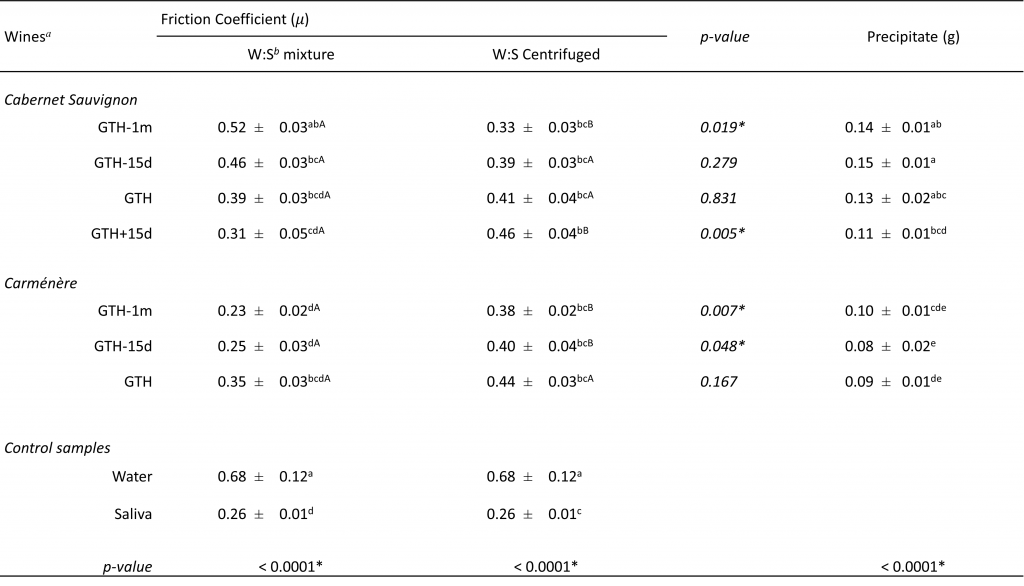
Data expressed as mean ± standard error of triplicate fractionation procedures, compared by one-way ANOVA (p<0.05); different letters indicate a significant difference at p<0.05 between wines and harvest dates treatments calculated by Tukey Means Comparison Method. Lowercase letters correspond to comparison between harvest dates, uppercase corresponds to comparison between centrifugated and non-centrifugated mixtures.
a Wines produced at different harvest dates: 1) one month before of grape-grower traditional harvest (GTH-1m), 2) 15 days before (GTH-15d), 3) traditional harvest defined by the grape-grower (GTH), and 4) 15 days after (GTH+15d).
b Human saliva and wine mixture (W:S) in a ratio 1:1.
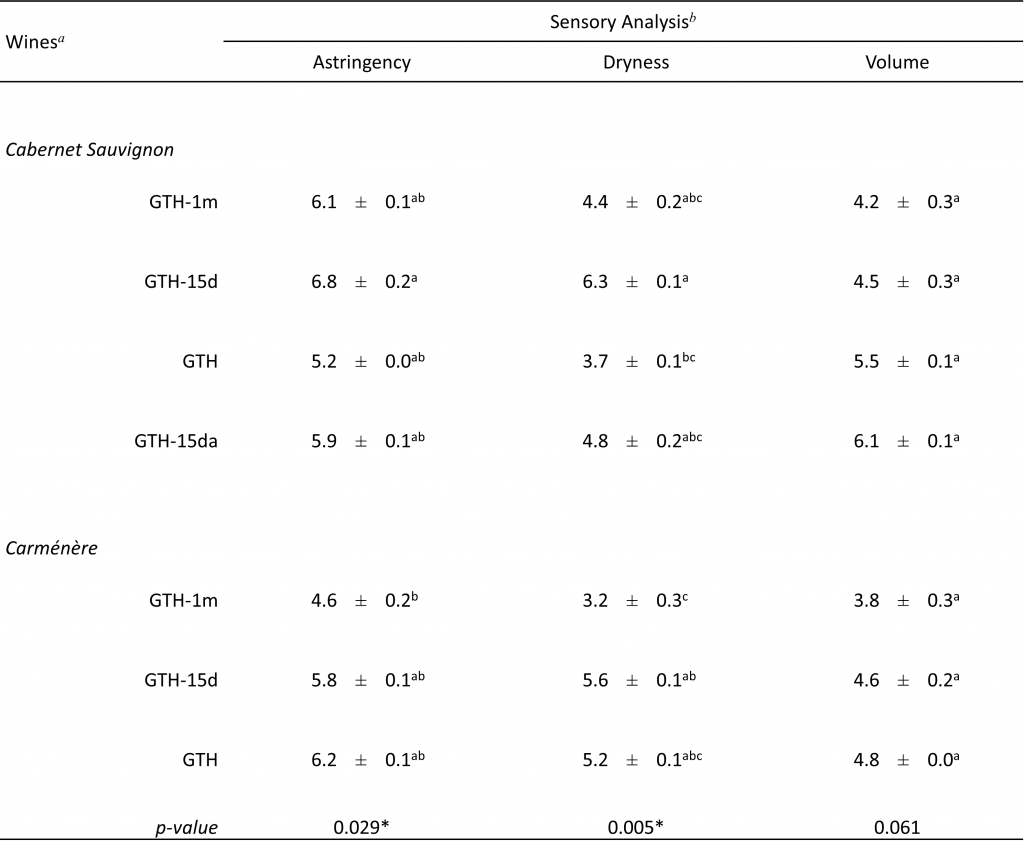
a Wines produced at different harvest dates: 1) one month before of grape-grower traditional harvest (GTH-1m), 2) 15 days before (GTH-15d), 3) traditional harvest defined by the grape-grower (GTH), and 4) 15 days after (GTH+15d).
b Sensory descriptors determined by a trained panel in triplicate.

Natalia Brossard
School of Agriculture and Forestry Sciences, Pontifical Catholic University of Chile
4860 Vicuña Mackenna Avenue, Macul, Santiago 7820436, Chile Tel: (+56) 223544165 – (+56) 223544159 Email: ndbrossa@uc.cl
References
Bajec, M.R. and Pickering, G.J., (2008). Astringency: mechanisms and perception. Critical reviews in food science and nutrition, 48(9), 858-875.
Basalekou, M., Kyraleou, M., Pappas, C., Tarantilis, P., Kotseridis, Y. and Kallithraka, S. (2019). Proanthocyanidin content as an astringency estimation tool and maturation index in red and white winemaking technology. Food chemistry, 299, 125135.
Brossard, N., Cai, H., Osorio, F., Bordeu, E. and Chen, J. (2016). Oral tribology study of astringency sensation of red wines. Journal of Texture Studies, 47(5), 392-402.
Cala, O., Dufourc, E. J., Fouquet, E., Manigand, C., Laguerre, M., & Pianet, I. (2012). The colloidal state of tannins impacts the nature of their interaction with proteins: the case of salivary proline-rich protein/procyanidins binding. Langmuir, 28(50), 17410-17418.
de Freitas, V., & Mateus, N. (2001). Structural features of procyanidin interactions with salivary proteins. Journal of Agricultural and Food Chemistry, 49(2), 940-945.
De Wijk, R.A., Prinz, J.F. (2005). The role of friction on perceived oral texture. Food Quality and Preferences, 16(2), 121-129.
Fernandez, K., Kennedy, J. A., Agosin, E. (2007). Characterization of Vitis vinifera L. cv. Carmenere grape and wine proanthocyanidins. Australian Journal of Grape and Wine Research, 55, 3675-3680.
Gawel, R. (1998). Red wine astringency: a review. Australian Journal of Grape and Wine Research, 4, 74–95.
Kallithraka, S., Bakker, J., Clifford, M.N., Vallis, L. (2001). Correlations between saliva protein composition and some T–I parameters of astringency. Food Quality and Preference, 12, 145–152.
Kennedy, J. A., Ferrier, J., Harbertson, J. F., & des Gachons, C. P. (2006). Analysis of tannins in red wine using multiple methods: Correlation with perceived astringency. American journal of enology and viticulture, 57(4), 481-485.
Llaudy, M.C., Canals, R., Canals, J.M., Rozés, N., Arola, L. and Zamora, F. (2004). New method for evaluating astringency in red wine. Journal of Agricultural and Food Chemistry, 52(4), 742-746.
Ma, W., Guo, A., Zhang, Y., Wang, H., Liu, Y., Li, H. (2014). A review on astringency and bitterness perception of tannins in wine. Trends in Food Science & Technology, 40(1), 6–19.
Prakash, S., Tan, D.D.Y. and Chen, J. (2013). Applications of tribology in studying food oral processing and texture perception. Food Research International, 54, 1627–1635.
Rossetti, D., Bongaerts, J.H.H., Wantling, E., Stokes, J.R., Williamson, A.-M. (2009) Astringency of tea catechin: More than an oral lubrication tactile percept. Food Hydrocolloids, 23, 1984–1992.
Rousseau, J. and Delteil, D. (2000). Présentation d’une methode d’analyse sensorielle des baies de raisin. Principe, méthode, interprétation. Rev. Fr. Oenol., 183, 10-13.
Sáenz-Navajas, M. P., Ferreira, V., Dizy, M., & Fernández-Zurbano, P. (2010). Characterization of taste-active fractions in red wine combining HPLC fractionation, sensory analysis and ultra performance liquid chromatography coupled with mass spectrometry detection. Analytica Chimica Acta, 673(2), 151-159.
Sáenz-Navajas, M. P., Ferrero-del-Teso, S., Romero, M., Pascual, D., Diaz, D., Ferreira, V., & Fernández-Zurbano, P. (2019). Modelling wine astringency from its chemical composition using machine learning algorithms. Oeno One, 53(3).
Schwarz, B., and Hofmann, T. (2008). Is there a direct relationship between oral astringency and human salivary protein binding? European Food Research and Technology, 227(6), 1693–1698
Upadhyay, R., & Chen, J. (2019). Smoothness as a tactile percept: Correlating ‘oral’ tribology with sensory measurements. Food Hydrocolloids, 87, 38-47.