
By Maxime Pacheco and Christian Coelho
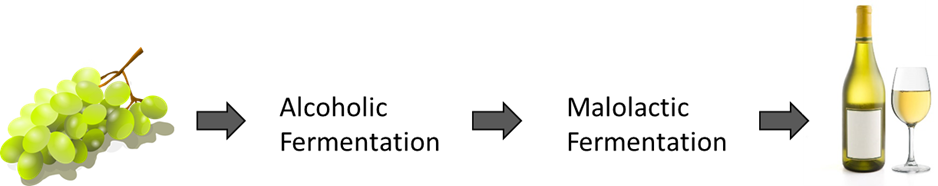
Malolactic fermentation (MLF) is an important parameter to control during wine making. This is a key step for some winegrowers who are looking for specific organoleptic profiles. This fermentation is now mostly under control and can start naturally or be induced. Many parameters can influence the start of MLF at the time of winemaking: maceration time, cultural techniques, addition of compounds (for example SO2), etc.
Among the qualitative criteria enhancing wine quality, MLF is a fermentative process that brings a reorganisation of the chemical composition of wines and contributes to flavour complexity. During this fermentative process, the phenolic profile of wines evolves and depends on the strains of lactic bacteria realizing MLF [1]. MLF has been shown to influence the concentrations of many products such as hydroxycinnamic acids and their derivatives, increasing the concentrations of caffeic/p-coumaric/ferulic acids and decreasing those in their precursors such as caftaric/coutaric/fertaric acids [1-4]. Additionally MLF could distinguish cool-climate and warm-climate wine producing regions in the world [5]. In those regions, differences in malic lactic consumption and derived metabolisms during berry maturation phase, would increase the chemical variability on grapes and therefore on MLF+/-Chardonnay wines on a world scale [5,6]. For that reason, the use of high-throughput fluorescence spectroscopic techniques to diagnose an elevated number of diverse wine samples combining chemometric tools appears to be a good alternative to evaluate both MLF+/- wine discrimination and associated chemical modifications.
Today, many devices and associated techniques allow the study of the evolution of the physico-chemical profile of a wine during these processes. Among them, stationary spectroscopy as well as the 3D fingerprints attributed to fluorescent compounds in wines are already widely used by many laboratories. However, fluorescence spectroscopy and in particular the study of fluorescence lifetimes is a technique not yet used in this field, to our knowledge. Again, the coupling of these techniques makes it possible to obtain new data that stationary spectroscopy could not provide.
Fluorescence spectroscopy techniques offer the advantage of a fast, robust and non-destructive characterization ability over expensive and time-consuming separative techniques. Their high sensitivity and specificity are important and allow the study of fluorescent compounds and chemical families among the complex chemistry present in food matrices and particularly wine. Over the past decade, much has been written on fluorescence usefulness in providing helpful classification indicators regarding cultural practices, varieties distinction, technological practices, regional authentication, adulteration and spoilage problematics [7-18].
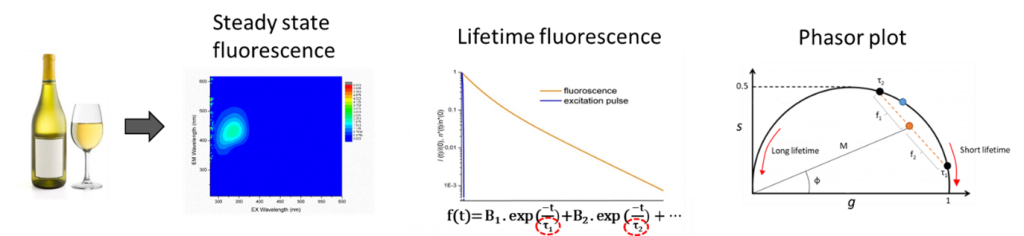
In this study, stationary and time-resolved fluorescence signatures, were statistically and chemometrically analyzed among three typologies of Chardonnay wines (A, B and C) with the objectives to evaluate their sensitivity to acidic and polyphenolic changes. For that purpose, a dataset was built using Excitation Emission Matrices of fluorescence (N=103) decomposed by a Parallel Factor Analysis (PARAFAC), and fluorescence decays (N=22), mathematically fitted, using the conventional exponential modelling and the phasor plot representation.
Wine PARAFAC component C4 coupled with its to their phasor plot g and s values enable the description of to describe malolactic fermentation (MLF) occurrence in Chardonnay wines. Such proxies reflect wine concentration modifications in total acidity, malic/lactic and phenol acids. Lower g values among fresh MLF+ wines compared to MLF- wines are explained by a quenching effect on wine fluorophores by both organic and phenolic acids. The combination of multispectral fluorescence parameters opens a novel routinely implementable methodology to diagnose fermentative processes.

Maxime Pacheco. He got a Bachelor’s degree in chemistry and a Master’s degree in Physico-chemistry and materials for living organisms at the University of Besançon, France. Since 2019, he is PhD student and works on the following subject: “Development of multidimensional spectroscopic techniques to facilitate monitoring of intrinsic/native fluorescence of biomolecules – Effect of pH and water activity” in the PMB/PCAV team in UMR PAM at Burgundy University, France.
Christian Coelho. He is associate professor at Vetagro Sup in the agronomic campus of Lempdes, France. He co-supervises Maxime’s PhD. His main research activity is based on the role of agricultural, fermentative and processing practices affecting quality and typicity of food and wine. For that purpose, he develops novel analytical tools based on spectroscopic, separative and sensory techniques coupled to chemometrics and modelling of complex data.
References
- Hernández, T., I. Estrella, M. Pérez-Gordo, E. G. Alegría, C. Tenorio, F. Ruiz-Larrrea, and, and M. V. Moreno-Arribas. 2007. “Contribution of Malolactic Fermentation by Oenococcus Oeni and Lactobacillus Plantarum to the Changes in the Nonanthocyanin Polyphenolic Composition of Red Wine.” Journal of Agricultural and Food Chemistry 55 (13): 5260–66.
- Cabrita, M.J., M. Torres, V. Palma, E. Alves, R. Patão, and A.M. Costa Freitas. 2008. “Impact of Malolactic Fermentation on Low Molecular Weight Phenolic Compounds.” Talanta 74 (5): 1281–86. https://doi.org/10.1016/j.talanta.2007.08.045.
- Hernández, Teresa, Isabel Estrella, Davinia Carlavilla, Pedro J. Martín-Álvarez, and M. Victoria Moreno-Arribas. 2006. “Phenolic Compounds in Red Wine Subjected to Industrial Malolactic Fermentation and Ageing on Lees.” Analytica Chimica Acta 563 (1–2): 116–25. https://doi.org/10.1016/j.aca.2005.10.061.
- Martínez-Pinilla, O., L. Martínez-Lapuente, Z. Guadalupe, and B. Ayestarán. 2012. “Sensory Profiling and Changes in Colour and Phenolic Composition Produced by Malolactic Fermentation in Red Minority Varieties.” Food Research International 46 (1): 286–93.
- https://doi.org/10.1016/j.foodres.2011.12.030.
- Bartowsky, E.J. 2005. “Oenococcus Oeni and Malolactic Fermentation – Moving into the Molecular Arena.” Australian Journal of Grape and Wine Research 11 (2): 174–87. https://doi.org/10.1111/j.1755-0238.2005.tb00286.x.
- Ruffner, H.P. 1982. “Metabolism of tartaric and malic acids in Vitis: a review.” Part B. Vitis 21 (4): 346–58.
- Airado-Rodríguez, Diego, Isabel Durán-Merás, Teresa Galeano-Díaz, and Jens Petter Wold. 2011. “Front-Face Fluorescence Spectroscopy: A New Tool for Control in the Wine Industry.” Journal of Food Composition and Analysis 24 (2): 257–64. https://doi.org/10.1016/j.jfca.2010.10.005.
- Cabrera-Bañegil, M., E. Valdés-Sánchez, D. Moreno, D. Airado-Rodríguez, and I. Durán-Merás. 2019. “Front-Face Fluorescence Excitation-Emission Matrices in Combination with Three-Way Chemometrics for the Discrimination and Prediction of Phenolic Response to Vineyard Agronomic Practices.” Food Chemistry 270: 162–72. https://doi.org/10.1016/j.foodchem.2018.07.071.
- Coelho, Christian, Alissa Aron, Chloé Roullier-Gall, Michael Gonsior, Philippe Schmitt-Kopplin, and Régis D. Gougeon. 2015. “Fluorescence Fingerprinting of Bottled White Wines Can Reveal Memories Related to Sulfur Dioxide Treatments of the Must.” Analytical Chemistry 87 (16): 8132–37. https://doi.org/10.1021/acs.analchem.5b00388.
- Elcoroaristizabal, S., R.M. Callejon, J.M. Amigo, J.A. Ocana-Gonzalez, M.L. Morales, and C. Ubeda. 2016. “Fluorescence Excitation-Emission Matrix Spectroscopy as a Tool for Determining Quality of Sparkling Wines.” Food Chem 206: 284–90. https://doi.org/10.1016/j.foodchem.2016.03.037.https://doi.org/10.1021/jf063638o.
- Mierczynska-Vasilev, A., K. Bindon, R. Gawel, P. Smith, K. Vasilev, H.-J. Butt, and K. Koynov. 2021. “Fluorescence Correlation Spectroscopy to Unravel the Interactions between Macromolecules in Wine.” Food Chem 352: 129343. https://doi.org/10.1016/j.foodchem.2021.129343.
- Moret, F., C. Lemaître-Guillier, C. Grosjean, G. Clément, C. Coelho, J. Negrel, and M. Adrian. 2019. “Clone-Dependent Expression of Esca Disease Revealed by Leaf Metabolite Analysis.” Frontiers in Plant Science 9 (1960). https://doi.org/10.3389/fpls.2018.01960.
- Ranaweera, Ranaweera K.R., Adam M. Gilmore, Dimitra L. Capone, Susan E.P. Bastian, and David W. Jeffery. 2021. “Authentication of the Geographical Origin of Australian Cabernet Sauvignon Wines Using Spectrofluorometric and Multi-Element Analyses with Multivariate Statistical Modelling.” Food Chemistry 335 (January): 127592. https://doi.org/10.1016/j.foodchem.2020.127592.
- Robert-Peillard, F., J.-L. Boudenne, and B. Coulomb. 2014. “Development of a Simple Fluorescence-Based Microplate Method for the High-Throughput Analysis of Proline in Wine Samples.” Food Chem 150: 274–79. https://doi.org/10.1016/j.foodchem.2013.10.135.
- Saad, Rita, Delphine Jouan-Rimbaud Bouveresse, Nathalie Locquet, and Douglas N. Rutledge. 2016. “Using PH Variations to Improve the Discrimination of Wines by 3D Front Face Fluorescence Spectroscopy Associated to Independent Components Analysis.” Talanta 153 (June): 278–84. https://doi.org/10.1016/j.talanta.2016.03.023.
- Santos, I.d, G. Bosman, J.L. Aleixandre-Tudo, and W. Toit. 2022. “Direct Quantification of Red Wine Phenolics Using Fluorescence Spectroscopy with Chemometrics.” Talanta 236: 122857. https://doi.org/10.1016/j.talanta.2021.122857.
- Wan, Y., F. Pan, and M. Shen. 2012. “Identification of Jiangxi Wines by Three-Dimensional Fluorescence Fingerprints.” Spectrochim. Acta, Part A 96: 605–10. https://doi.org/10.1016/j.saa.2012.07.030.
- Zhong, X.-D., D.-S. Fu, P.-P. Wu, Q. Liu, G.-C. Lin, S.-H. Cao, and Y.-Q. Li. 2014. “Rapid Fluorescence Spectroscopic Screening Method for the Sensitive Detection of Thiabendazole in Red Wine.” Anal. Methods 6 (18): 7260–67. https://doi.org/10.1039/C4AY00991F.