
By Tatiana Bernardi,* Olga Bortolini, Alessandro Massi, Gianni Sacchetti, Massimo Tacchini and Carmela De Risi*
This post is a summary of recently published results concerning the investigation of wine-making by-products by synergistic use of high-performance thin-layer chromatography (HPTLC) and high-performance liquid chromatography with diode array detection (HPLC-DAD) [1].
This work fits into a more general context related to the revalorization of agri-food by-products, which is extremely current for both environmental and economic reasons [2,3].
With particular regard to wine-making by-products, it is known that they are sources of biologically relevant compounds, mostly polyphenols, such as flavonoids and phenolic acids [4,5]. Thanks to the biological activities of these constituents (e.g. antioxidant, antiinflammatory, antimicrobial, antibacterial) [6-9], grape wastes could be re-used for applications in various fields, such as the nutraceutical and pharmaceutical ones. Accordingly, it is desirable to develop methods for isolation, characterization and quantification of molecules contained in winery by-products, especially in view of their re-utilization on a large scale.
Phenolic compounds present in natural matrices have been investigated by HPTLC [10-14], sometimes in conjuction with HPLC [15,16]. To the best of our knowledge, each method has been generally used to confirm the results of the other, and no further information was inferred by comparing the data obtained from each technique.
Based on these literature findings and our experience on the analysis of complex samples through HPTLC [17-20], we have developed the work in question, proving that HPTLC and HPLC-DAD are really complementary in both determining and quantifying flavonoid and non-flavonoid compounds within wine-making by-products.
Going into more detail, we investigated two types of winery by-products, that is pomace (stalks, seeds, skins) and desiccated seeds deriving from both Italian red (Lambrusco) and white (Trebbiano) cultivars of Vitis vinifera L. After being dried (ventilated oven, 70 °C, 24 h), these materials were subjected to solid-liquid extraction procedures (Naviglio® extractor [21], ultrasounds) using pure ethanol-water mixtures with increasing water content up to 100% [9].
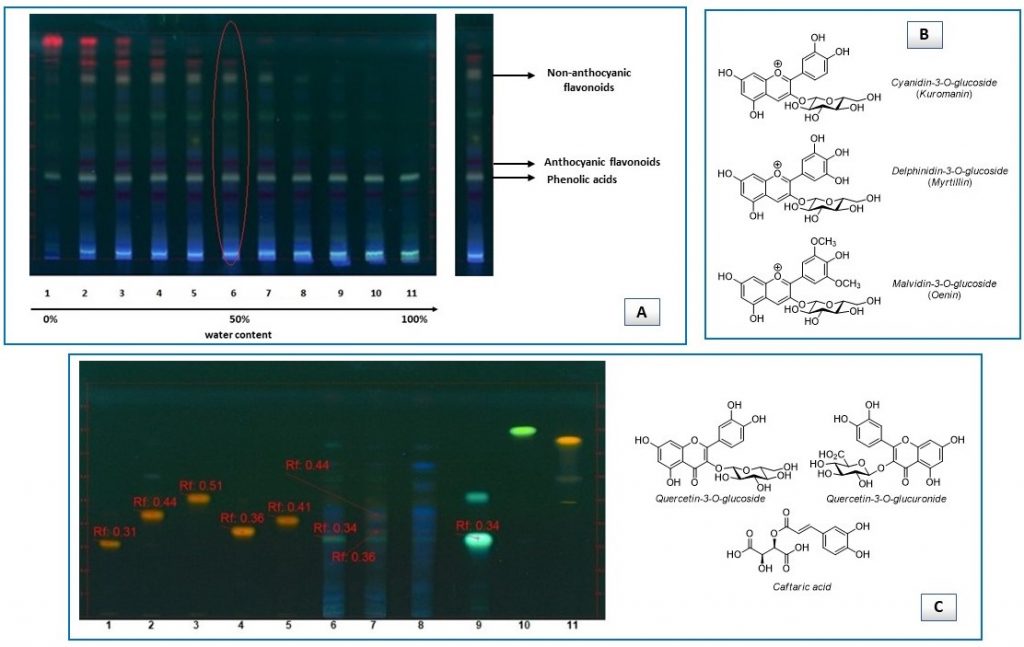
Next, HPTLC fingerprint evaluation [22] served to establish the best extraction solvent (50/50 pure ethanol-water) and identify the major classes of organic compounds (anthocyanins, phenolic acids, non-anthocyanic flavonoids) present in the extracts on the basis of analyte spots intensity and color, after derivatization with NP/PEG reagent (Figure 1A).
Concurrent investigation based on HPTLC/mass spectrometry (MS) interface and band comparison method gave indications on the type of molecules. In particular, only anthocyanins could be detected by HPTLC/MS: cyanidin-3-O-glucoside (kuromanin), delphinidin-3-O-glucoside (myrtillin) and malvidin-3-O-glucoside (oenin) were the main species (Figure 1B), with the latter being found in greater quantity. It is worthwhile noting that chromatogram zones corresponding to phenolic acids and non-anthocyanic flavonoids gave no noticeable signals in the mass spectra, probably due to their low concentration in the extracts, given that more than 250 ng/zone are required to have a significant visualization with MS interfaced to HPTLC [23].
On the other hand, phenolic acid (i.e. caftaric acid) and non-anthocyanic flavonoid (i.e. quercetin 3-O-glucuronide, quercetin-3-O-glucoside) compounds were assigned by comparison of their bands (color and retardation factor) with those of available standards (Figure 1C).
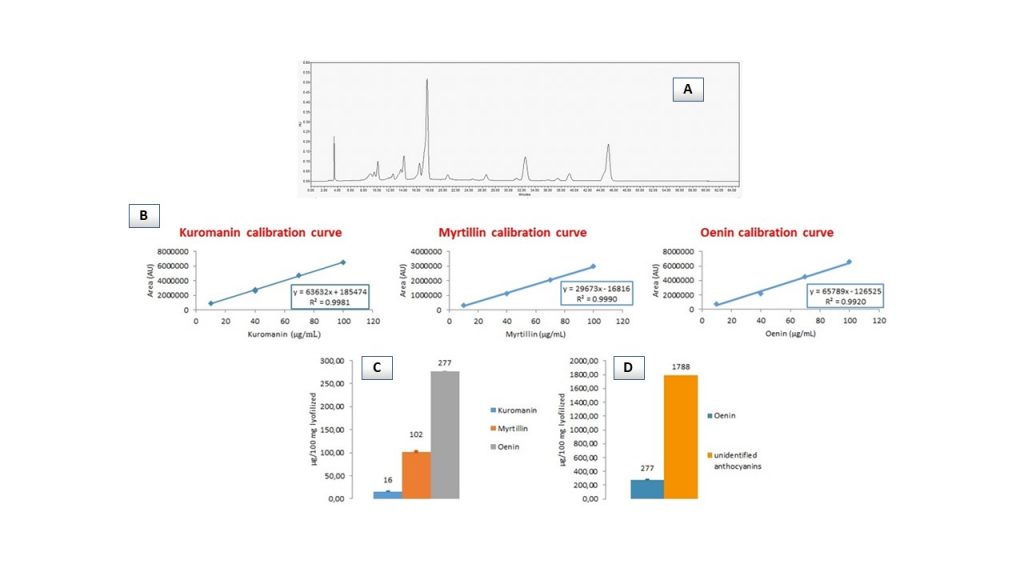
Subsequent HPLC-DAD screening of red grape pomace extracts led to identify just anthocyanins at 520 nm (Figure 2A) and surprisingly, the same molecules have been identified in the extracts deriving from seeds incorporated in red grape pomace samples. This was in contrast with literature reports indicating that anthocyanins are not found in grape seeds [24], but it may be assumed that the contact between seeds and skins during grape processing may lead to this consequence.
Importantly, the absence in the chromatograms of peaks related to phenolic acids and non-anthocyanic flavonoids (wavelenght range 250-370 nm) has proven not to depend on sample concentration, indeed both types of compounds could not be detected while increasing the concentration of the injected sample solutions up to the limits of filterability (70 mg/mL).
In light of the above, what obtained by HPLC-DAD seemed to contradict the information given by HPTLC fingerprint, however some possible explanations could be offered. Possibly, the concentration of either phenolic acids or non-anthocyanic flavonoids, even when present, is so low that they may be lost during sample pre-treatment (filtration) before HPLC-DAD analysis. On this point, it has to be noted that the supposed low concentration of these species matches the results observed in HPTLC-MS studies. Moreover, it cannot be excluded that the limit of detection (LOD) of DAD was responsible for the incomplete (false) analytical response.
Suitably optimized HPLC-DAD chromatographic conditions (modified Flamini and Favretto [25] method) allowed to identify delphinidin-3-O-glucoside (myrtillin), cyanidin-3-O-glucoside (kuromanin) and malvidin-3-O-glucoside (oenin) in the extracts, confirming what we found by way of HPTLC-MS. Then, quantification via calibration curve method (Figure 2B) showed that oenin was the most abundant species, followed by myrtillin and kuromanin in this order (Figure 2C). At the same time, it was possible to quantify the content of unidentified anthocyanins building on the calibration curve of oenin (Figure 2D).
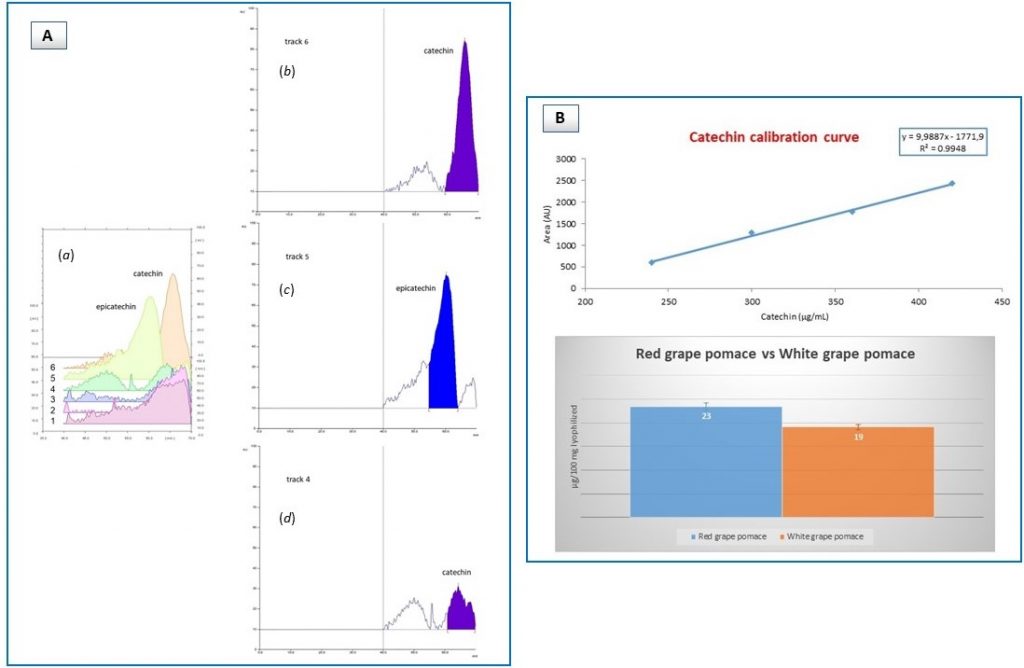
In addition, HPLC-DAD chromatograms provided an indication of the presence of proanthocyanidins (baseline drift at 280 nm), but their identification was not possible.
Instead, HPTLC helped with that, in fact inspection of representative extracts deriving from red (white) grape pomace and seed materials showed that catechin was the only compound present, as demonstrated by densitogram profiles (Figure 3A). Additional HPTLC analysis corroborated this observation, with higher molecular weight derivatives (i.e. epigallocatechin, epigallocatechin gallate) being not found at all. Finally, catechin content was shown to be about the same in both red and white grape pomace extracts (Figure 3B).
To conclude, this work confirmed the potential of both HPTLC and HPLC-DAD for the analysis of complex mixtures, also showing that the advantages of one technique could be exploited to compensate for the limits of the other. Thus, typical features of HPTLC (minimal sample manipulation, i.e. dilution, low LOD, multiple derivatization) have helped achieve a greater extracts characterization (anthocyanins, non-anthocyanic flavonoids, phenolic acids) that supplemented the limited information given by HPLC-DAD (anthocyanins) for same sample types. Although HPLC-DAD gives the advantage of monitoring matrices content in typical wavelength ranges with just one injection, either sample pre-treatment (filtration) or LOD of detector might provide incomplete (false) results, in apparent contradiction with HPTLC response. This being the case, each technique is not just for confirming the data provided by the other, as usually done, but one adds to the other.
Acknowledgments: Thanks are due to the regional funding POR-FESR 2014–2020 within the project “Valorizzazione sostenibile degli scarti della filiera vitivinicola per l’industria chimica e salutistica (VALSOVIT)”.
For more information about this study, go to the DOI: 10.3390/molecules24193416

Tatiana Bernardi (right) graduated in Chemistry at the University of Ferrara in 1997. She worked at the Basell laboratories as Quality Controller of polymers production (1998-1999), then she moved back to the University of Ferrara and was hired as a technician. She received a master’s degree in “Sugar and Alcohol Technology” from the University of Ferrara (2003) and her PhD in “Applied Bio-Catalysis and Industrial Microbiology” from the University of Bologna (2008). She is presently technician (level C5) at the Department of Chemical and Pharmaceutical Sciences of the University of Ferrara. Her main research interests are in the analytical field, with particular regard to high-performance thin-layer chromatography (HPTLC, AMD-OPLC) and high-performance liquid chromatography (HPLC), in mass spectrometry applications, and also include industrial microbiology and fermentation developments and monitoring.
Mail: tatiana.bernardi@unife.it
ORCID ID: https://orcid.org/0000-0001-5452-5775
Scopus Author ID: 8343635300
Carmela De Risi (left) graduated in Chemistry at the University of Ferrara (1992) and received her PhD in Organic Chemistry in 1996. That same year, she joined the group of Prof. P. Vogel at the University of Lausanne (Switzerland) where she spent one year research as a grant holder. Then, she moved back to the University of Ferrara where she performed postdoctoral studies (1997-1999). Since November 1999 she has been Research Associate at the University of Ferrara. Her main research interests focus on synthesis and modification of biologically active compounds, general synthetic methodologies, organocatalysis, biomass valorization.
Mail: carmela.derisi@unife.it
ORCID ID: https://orcid.org/0000-0001-8162-6782
Scopus Author ID: 6603965163
References:
- Bernardi, T.; Bortolini, O.; Massi, A.; Sacchetti, G.; Tacchini, M.; De Risi, C. Exploring the Synergy Between HPTLC and HPLC-DAD for the Investigation of Wine-Making By-Products. Molecules, 2019, 24, 3416.
- Bacic, T. Recovery of valuable products from lees and integrated approach to minimise waste and add value to wine production, Melbourne, 2003. Available on line: UM 01-01 RECV 5-3-04.doc-www.wineaustralia.com/getmedia/ a5fe1546-389d-45ef-bc85-e651097b1e79/UM-01-01.
- FAO, 2012. El estado mundial de la agricultura y la alimentación 2012. FAO Inter-Departmental Working Group, Roma.
- Ali, K.; Maltese, F.; Choi, Y.; Verpoorte, R. Metabolic constituents of grapevine and grape-derived products. Phytochem. Rev. 2010, 9, 357–378.
- Garrido, J.; Borges, F. Wine and grape polyphenols – a chemical perspective. Food Res. Int. 2013, 54, 1844–1858.
- Teixeira, A.; Baenas, N.; Dominguez-Perles, R.; Barros, A.; Rosa, E.; Moreno, D.A.; Garcia-Viguera, C. Natural bioactive compounds from winery by-products as health promoters: a review. Int. J. Mol. Sci. 2014, 15, 15638–15678.
- Denny, C.; Lazarini, J.G.; Franchin, M.; Melo, P.S.; Pereira, G.E.; Massarioli, A.P.; Moreno, I.A.M.; Paschoal, J.A.R.; Alencar, S.M.; Rosalen, P.L. Bioprospection of Petit Verdot grape pomace as a source of anti-inflammatory compounds. J. Funct. Foods 2014, 8, 292–300.
- Mattos, G.N.; Tonon, R.V.; Furtado, A.A.L.; Cabral, L.M.C. Grape by-product extracts against microbial proliferation and lipid oxidation: a review. J. Sci. Food Agric. 2017, 97, 1055–1064.
- Tacchini, M.; Burlini, I.; Bernardi, T.; De Risi, C.; Massi, A.; Guerrini, A.; Sacchetti, G. Chemical characterisation, antioxidant and antimicrobial screening for the revaluation of wine supply chain by-products oriented to circular economy. Plant. Biosyst. 2019, 153, 809-816.
- Ezhilan, B.; Neelamegam, R. HPTLC analysis of flavonoid compound profile in the whole-plant methanol extract of Polygonum species. Int. J. Adv. Res. Biol. Sci. 2015, 2, 26–33.
- Nile, S.H.; Park, S.W. HPTLC densitometry method for simultaneous determination of flavonoids in selected medicinal plants. Front. Life Sci. 2015, 8, 97–103.
- Patel, M.R.; Solanki, J.D.; Panchal, H.S. HPTLC fingerprinting of root extracts of Vitis vitigenia L. Int. J. Pharm. Pharm. Res. 2016, 7, 175–181.
- Stanek, N.; Jasicka-Misiak, I. HPTLC phenolic profiles as useful tools for the authentication of honey. Food Anal. Meth. 2018, 11, 2979–2989.
- Jug, U.; Glavnik, V.; Kranjc, E.; Vovk, I. HPTLC–densitometric and HPTLC–MS methods for analysis of flavonoids. J. Liq. Chromatogr. Relat. Technol. 2018, 41, 329–341.
- Bazylko, A.; Boruc, K.; Borzym, J.; Kiss, A.K. Aqueous and ethanolic extracts of Galinsoga parviflora and Galinsoga ciliata. Investigations of caffeic acid derivatives and flavonoids by HPTLC and HPLC-DAD-MS methods. Phytochem. Lett. 2015, 11, 394–398.
- Kranjc, E.; Albreht, A.; Vovk, I.; Makuc, D.; Plavec, J. Non-targeted chromatographic analyses of cuticular wax flavonoids from Physalis alkekengi L. J. Chromatogr. A 2016, 1437, 95–106.
- Bernardi, T.; Pedrini, P.; Marchetti, M.G.; Tamburini, E. Separation and quantitative determination of carbohydrates in microbial submerged cultures using different planar chromatography techniques (HPTLC, AMD, OPLC). J. Anal. Bioanal. Tech. 2015, 6, 1000250/1–1000250/9.
- De Lucia, D.; Manfredini, S.; Bernardi, T.; Vertuani, S. High-performance thin-layer chromatography (HPTLC): a new green approach to soluble fiber determination in plant matrices. Food Anal. Meth. 2015, 8, 32–39.
- De Lucia, D.; Manfredini, S.; Vertuani, S.; Bernardi, T. New insights into sugar characterization in complex plant matrices by HPTLC (high-performance thin-layer chromatography). J. Liq. Chromatogr. Relat. Technol. 2016, 39, 607–612.
- Costa, S.; Rugiero, I.; Pedrini, P.; Bernardi, T.; Tamburini, E. Simultaneous quantification of carbohydrates and metabolites in multicomponent fermentation broths by means of high-performance thin-layer chromatography. J. Planar Chromatogr. 2017, 30, 170–174.
- Naviglio, D. Naviglio’s principle and presentation of an innovative solid-liquid extraction technology: extractor Naviglio®. Anal. Lett. 2003, 36, 1647–1659.
- Wagner, H.; Bladt, S. Plant Drug Analysis. A Thin Layer Chromatography Atlas, 2nd ed.; Springer-Verlag: Brooklyn, New York, 1996; pp 196–212.
- Pedan, V.; Weber, C.; Do, T.; Fischer, N.; Reich, E.; Rohn, S. HPTLC fingerprint profile analysis of cocoa proanthocyanidins depending on origin and genotype. Food Chem. 2018, 267, 277–287.
- Gouot, J.C.; Smith, J.P.; Holzapfel, B.P.; Walker, A.R.; Barril, C. Grape berry flavonoids: a review of their biochemical responses to high and extreme high temperatures. J. Exp. Bot. 2019, 70, 397–423.
- Favretto, D.; Flamini, R. Application of electrospray ionization mass spectrometry to the study of grape anthocyanins. Am. J. Enol. Vitic. 2000, 51, 55–64.