
By: Lydia Hayward and Matthew McSweeney
Nova Scotia is a province in Eastern Canada. Nova Scotia is a relatively new wine region and currently has eighteen wineries and six main growing areas, with over 30 grape varieties grown in these geographical regions. These regions include the Annapolis Valley, Avon/Bear River Valley, Gaspereau Valley, LeHave River Valley and the Northumberland Coast. Each area is distinct in its geology, soil types, and climates, providing a range of variation between the wines produced. The popularity of wine production in Nova Scotia has grown significantly. In recent years, the wine and grape industry in Nova Scotia has been gaining recognition while also generating $218 million a year (Wines of Nova Scotia, 2015). This growth has had a significant benefit on both the economy and employment within the province of Nova Scotia.
With the number of wines being produced in Nova Scotia (NS) and the variety of the grapes used in these wines increasing, there is a need to determine the attributes consumers use to describe Nova Scotia wines and identify similarities and differences in the wines. As such, this study specifically investigated rosé wines produced in NS. Rosés are well known for their fruity and sweet characteristics, are often refrigerated and are lighter in body (Darici, Cabaroglu, Ferreira, & Lopez, 2014). Projective mapping (PM) and ultra-flash profiling were used to determine the similarities and differences between NS rosé wines, as well as to describe them. Projective mapping (PM) is a method used to assess and describe differences among samples. The samples are presented to the participants, who are then required to place samples on a two-dimensional space to reflect their perception of the samples’ differences. Thus, participants are informed to put similar samples closer together, and those that are different are placed further apart (Risvik, McEwan, Colwill, Rogers, & Lyon, 1994). Projective mapping is often used with ultra-flash profiling (UFP) to provide descriptions of each sample, UFP asks the panellists to identify their own set of attributes. Participants list adjectives next to each sample during the PM task (Santos et al., 2013). The results are then analyzed using a multiple factor analysis (MFA).
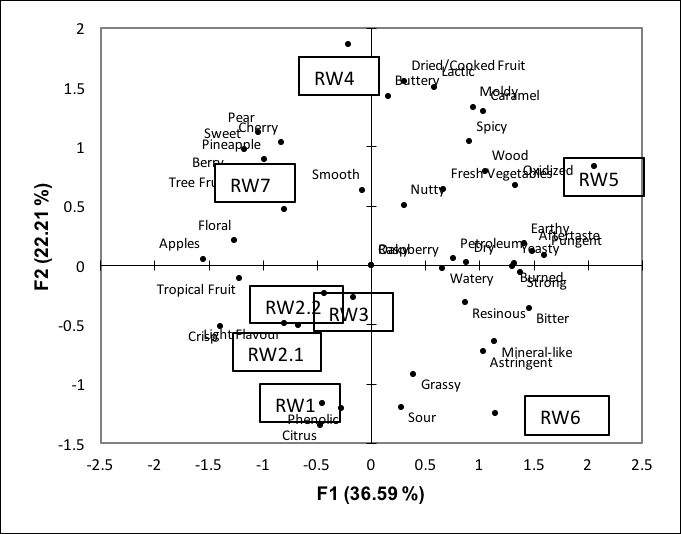
The participants (n=85) were presented with eight rosé wines, seven different wines and one wine was presented twice. All of the rosé wines were produced in NS and were presented blinded to the participants. The participants were instructed on how to complete a PM and UFP task. The results of the PM and UFP trial are shown in Figure 1. The wine (RW2.1 and RW2.2) that was presented twice were positioned close together, indicating that the participants were able to distinguish their similarity and support their ability to reproduce the results. In total, the participants used 43 descriptors (only descriptors identified four or more times were included; Figure 1) to describe the wines. Overall, the participants separated the rosé wines based on their fruit flavour or lack of fruit flavour.
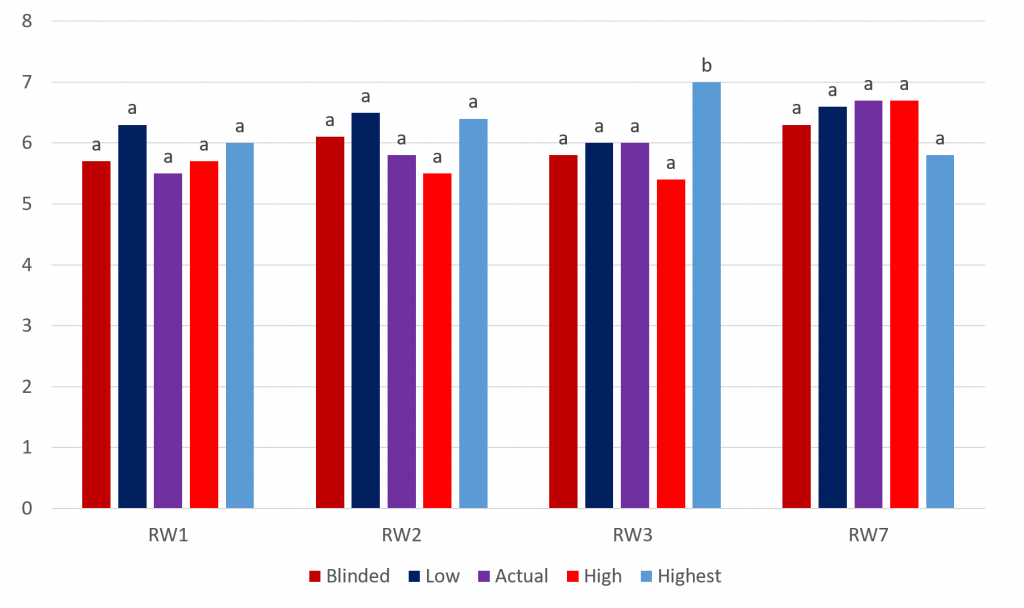
The second objective of the study was to investigate the influence caloric values had on consumers’ sensory perception of rosé wine. For this task, 260 consumers of wine (had consumed wine in the last two weeks, regularly bought and consumed wine) were recruited and four NS rosé wines, from the previous trial, were selected to be evaluated. Each wine was evaluated blinded and with each caloric value an equal number of times. The fabricated caloric values included a low (15 Calories), normal (100 Calories), high (180 Calories), and highest (240 Calories) calorie label per one serving (5 oz or 150ml). This task asked the participants to evaluate the wine sample for its’ appearance, flavour, mouthfeel, and overall liking of each sample using a 9-point hedonic scale (1= Dislike Extremely to 9= Like Extremely). Participants were then asked to complete a check-all-that-apply (CATA) questionnaire. The CATA method provides a questionnaire with a set of terms, and they are then asked to select all those descriptors that they perceive to be related to the given sample (Jaeger et al., 2015). The attributes included in the CATA questionnaire were the twenty most frequently used (21, due to a tie) descriptors identified in the PM and UFP task. The results of the 9-point hedonic scales were analyzed using ANOVA and Tukey HSD test, and the results of the CATA questionnaire were analyzed using a contingency table and Cochran’s Q test. Additionally, a penalty analysis was completed following the procedure by Meyners and Castura (2016).
Overall, evaluation of the four NS rosé wines with and without the addition of caloric values demonstrated no significant differences in participants’ liking (Figure 2). The results of the CATA questionnaire and overall liking of the four NS rosé wines when they were evaluated blinded were analyzed using penalty analysis. It indicated that fruit-related attributes (crisp, sweet and berry) drove liking of rosé wines, while qualities including aftertaste, sour, astringent, and bitter lead to the disliking of rosé wines. The results of this study illustrate that Atlantic Canadian consumers preferred fruit flavours in rosé wines. Furthermore, the labelling of caloric values did not affect Atlantic Canadian consumers’ sensory perception or liking of rosé wines. The results of this study are relevant to the wine industry and nutrition policymakers as they provide context and clarity related to how the presentation of nutrition information on alcoholic beverages, specifically wine, can influence consumers’ motivations.
Those interested in the study can find it at: https://www.sciencedirect.com/science/article/pii/S0963996919306477

Lydia Hayward 
Matthew McSweeney
Lydia Hayward– Lydia is currently a Dietetic Intern with the Nova Scotia Health Authority in Halifax, NS, and a graduate of Acadia University from Nutrition & Dietetics (Honours). Hayward’s Honours researched focused on the sensory evaluation of Nova Scotia wines. At Acadia, she also worked as a research assistant with Dr. Matt McSweeney in the Centre for the Sensory Research of Food, where Nova Scotia wines were a primary focus.
Matthew McSweeney– Matt is the Director of the Centre for the Sensory Research of Food and an Associate Professor in the School of Nutrition and Dietetics at Acadia University.
References
- Darici M., Cabaroglu T., Ferreira V., & Lopez R. (2014). Chemical and sensory characterisation of the aroma of Çalkarası rosé wine. Australian Journal of Grape and Wine Research, 20(3), 340–346.
- Jaeger, S., K. Beresford, M., Paisley, A., Antúnez, L., Vidal, L., Cadena, R., Giménez, A., Ares, G. (2015). Check-all-that-apply (CATA) questions for sensory product characterization by consumers: Investigations into the number of terms used in CATA questions. Food Quality and Preference, 42. 154-164.
- Meyners, M., & Castura, J. C. (2016). Randomization of CATA attributes: Should attribute lists be allocated to assessors or to samples? Food Quality and Preference, 48(Part A), 210–215.
- Risvik, E., McEwan, J. A., Colwill, J. S., Rogers, R., & Lyon, D. H. (1994). Projective mapping: A tool for sensory analysis and consumer research. Food Quality and Preference, 5(4), 263–269.
- Santos, B. A., Pollonio, M. A. R., Cruz, A. G., Messias, V. C., Monteiro, R. A., Oliveira, T. L. C., & Bolini, H. M. A. (2013). Ultra-flash profile and projective mapping for describing sensory attributes of prebiotic mortadellas. Food Research International, 54(2), 1705–1711.
- Wines of Nova Scotia. (2017). Canadian Wine & Grape Industry 2015 Economic Impact Study. Retrieved January 21, 2020, from https://winesofnovascotia.ca/canadian-wine-grape-industry-2015-economic-impact-study/