By Qian Janice Wang and Domen Prešern
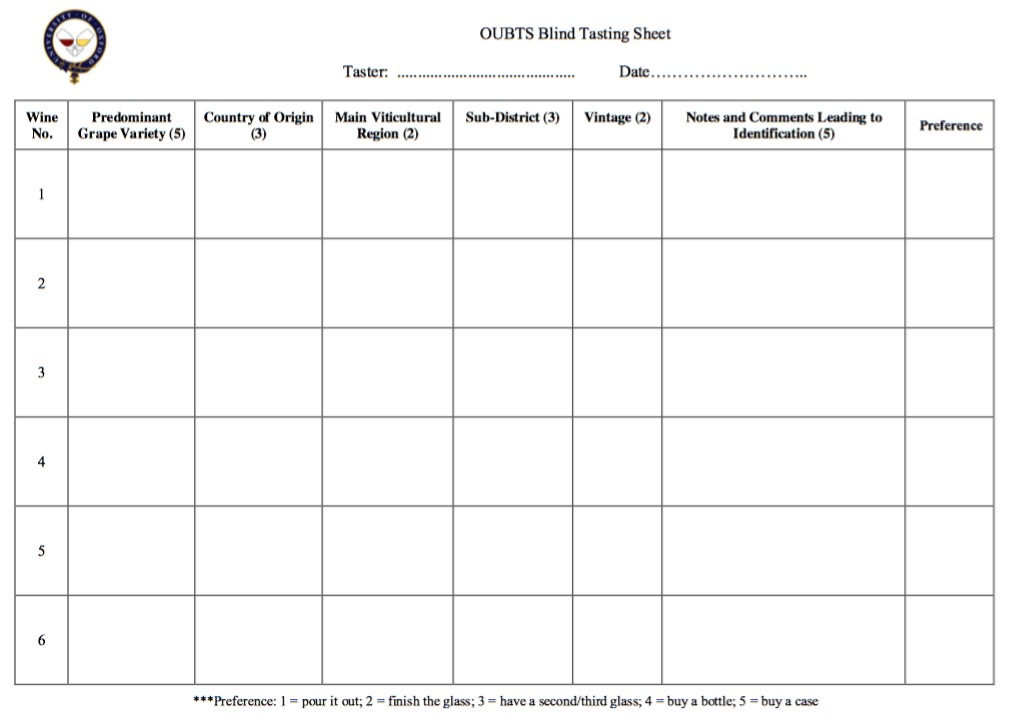
Blind wine tasting refers to the practice of tasting a wine without seeing the label, and deducing the grape variety, location of origin, and vintage of the wine based on what one perceives and infers from the glass. Both the Master of Wine (MW) and the Master Sommelier (MS) exam contains elements of blind tasting, perhaps most recently popularised by the 2013 American documentary SOMM which followed four Master Sommelier candidates as they prepared for the examination. But can one actually be trained to deduce a wine’s origins, or is it just nonsense? Over at The Economist data team, Dan Rosenheck (2017) performed an analysis of guesses made at the 2017 Oxford-Cambridge varsity blind tasting match and deduced that most wines were deduced at a rate better than chance. The varsity match, now in its 65th year, is the oldest university based wine competition in the world (Segal et al., 2013). The competition involves blind tasting 12 wines in two flights – one white, one red. Many illustrious names in the British wine trade, including the likes of Oz Clarke, Jasper Morris, and Mark Savage, first cut their teeth at the varsity match.
Earlier this year, as the Oxford University Blind Tasting Society started their training season, we had a unique opportunity to follow the progress of a group of relatively novice tasters as they went through the intensive five-week training program under the watchful eye of long-time coach and Oxford Companion to Wine contributor, Hanneke Wilson. The study, funded by an American Association of Wine Economists research scholarship, aimed to get a longitudinal view of expertise acquisition over an intense period of blind tasting training, where participants attend multiple tastings a week over a period of 36 days. This allowed us to study both within participant development and group-wide accuracy as a whole (e.g. variance of guesses within a group), as well as track people’s shifts in wine preference. While wine preference is not explicitly a part of the blind tasting match, we believed it is an important question to investigate. Given the rapid rise of knowledgeable wine tasters in developing markets (e.g. China, see Li & Bardaji, 2017), it is crucial to understand how increasing expertise can influence preference for specific wine styles (e.g., less fruit-driven, higher acid, more bottle maturation, etc.). Because the wines were tasted blind, we were be able to track preference for only wine-intrinsic attributes without the participants being biased by the label, price, or origin information (Almenberg & Dreber, 2011; D’Alessandro & Pecotish, 2013; Mueller & Szolnoki, 2010). Over 36 days, we collected a total of 2271 tasting notes and guesses from 15 participants (3 women, 12 men) who participated in 18 tasting sessions. A total of 212 wines were tasted (104 whites, 109 reds) ranging in vintages from 2005-2017, and ranging in price from £7 to £35 (with 75% of the wines between £12 and £18). There were a total of 44 grape varieties (23 white, 21 red), 14 countries, and 44 regions.
We proposed five hypotheses, related to questions of whether and how training can improve blind tasting accuracy, and, from a commercial prospective, how wine preferences change with increased wine-tasting experience.
Hypothesis 1: Training will reduce within group variability in guesses.
We calculated, for each training session, the average number of people who agreed on a guess of grape variety, country, region, and vintage. Over time, we saw a significant increase in the number of people who agreed in their guess for grape variety (remember, everyone tasted the wines in silence and made their guesses individually), and no changes for country, region, or vintage.
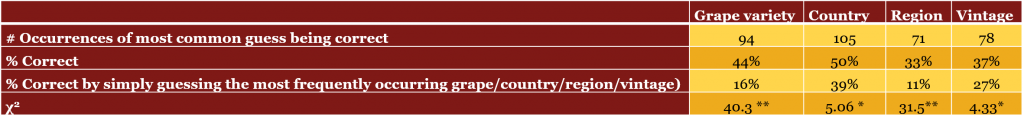
Furthermore, we looked at the most common within-group guess of grape variety, country, region, and vintage guess for each wine. As it turned out, the probability of the most common guess being correct was 1) significantly higher than random chance, and 2) significant higher than if they had just guessed the most frequently occurring grape variety, country, region, or vintage.
ypothesis 2: Training will make participants more accurate in their guesses.
Pearson’s correlation coefficients between time and the number of accurate answers revealed that grape variety accuracy did increase over time. We did not observe any improvements with regard to country and region guesses, and vintage accuracy actually went down! This might be because in the beginning, people were merely guessing the most recent vintage for all the wines, which tended to be correct. As they became more confident, however, they begun varying vintage guesses which led to more errors.
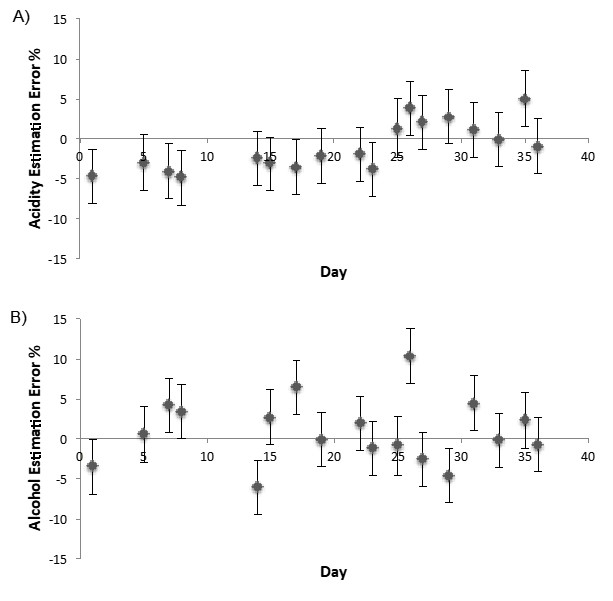
Hypothesis 3: Training will make participants more accurate in their structural assessment of wines.
With regard to structural elements in the wine, we decided to assess participants’ accuracy in evaluating the acid (low, medium, crisp, high) and alcohol levels (low, medium, high). Over time, we observed that participants gradually went from underestimating acidity to overestimating acidity, but with the net effect of increasing accuracy over time. In terms of alcohol levels, we did not observe any significant changes in accuracy over time. However, it should be kept in mind that for both acidity and alcohol, error levels (in terms of %) were not significantly different from 0! (In other words, people are pretty good at discerning wine structure).
Hypothesis 4: Training will change the way participants write tasting notes, leading to the usage of more specific descriptors and a different body of vocabulary.
One interesting result that came out of our tasting note analysis was that tasting notes for the more preferred wines were significantly longer (by 23%) than for the less preferred wines! We did not observe a difference in the length of tasting notes or the size of vocabulary pool over the training session, although those with prior experience (e.g. returning team members) wrote longer tasting notes than those without prior experience.
Hypothesis 5: Training will change the tasters’ wine preference, leading them to prefer less fruit-forward and/or more structured wines.
This was probably the most interesting finding from our study. Overall, wine preference was positive correlated with wine age, acidity, sweetness, and colour (red wine was preferred to white). Over time, we observed a shift in preference towards older wines, and a decrease in the importance of wine colour. Those with little initial blind tasting training also experienced a change in preference towards greater acidity and alcohol, and decreased their preference for oak.
In conclusion, over the 36-day training period, we observed an increase in accuracy and within-group agreement in terms of grape variety guesses. Moreover, the most commonly guessed grape, country, region, and vintage were all more accurate than chance. Structurally, acidity assessment accuracy improved, although error margins for both acidity and alcohol were not significantly different from zero. Finally, with training, there was a shift in wine preference towards more mature and structured wines, which has important implications for growing wine markets with an increasingly educated consumer population.
Those interested in a longer length report can download the working paper at http://www.wine-economics.org/aawe/wp-content/uploads/2018/06/AAWE_WP230.pdf
Qian Janice Wang is an Experimental Psychologist currently working as a postdoctoral researcher at the Crossmodal Research Lab at Oxford University. Her research examines crossmodal correspondences between flavour and the senses of sight, sound, and touch; with a special focus on how auditory stimuli can modify and enhance the way we perceive food and drink. She has 24 peer-reviewed publications and her work has been featured in the Financial Times, The Economist, The Telegraph, National Post Canada, Le Figaro, Purple Pages, and la Revue du Vin de France, amongst others.
Domen Prešern is a current PhD student in Theoretical Chemistry at Oxford University. He uses supercomputers to study mechanical and thermodynamical properties of complex DNA (origami) structures.
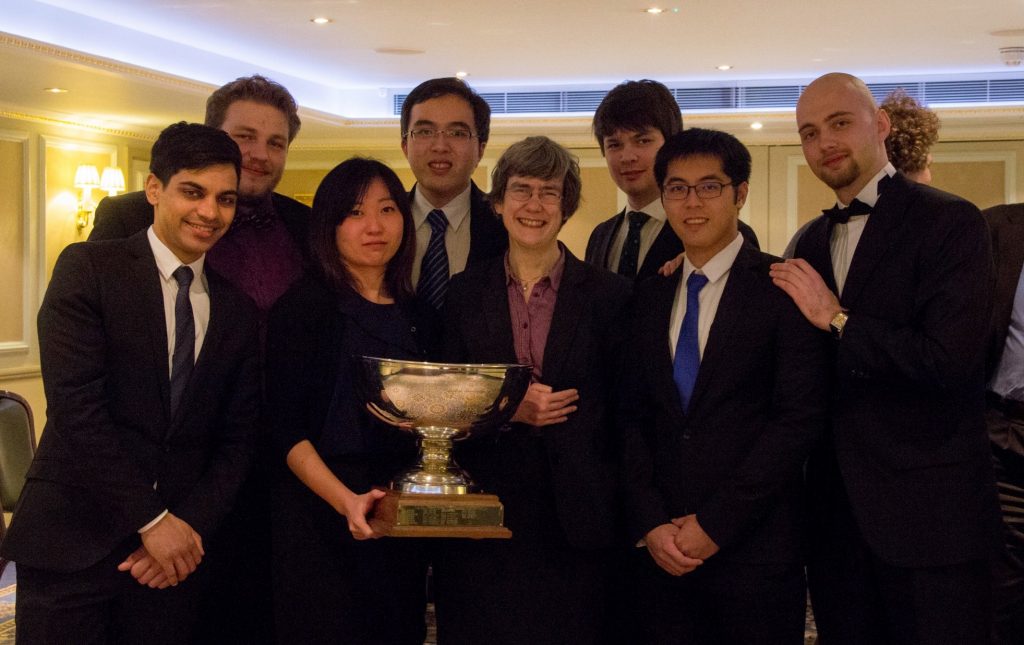
Domen is the current president of the Oxford University Blind Tasting Society, and Janice was the president of the Oxford University Blind Tasting Society from 2015-2017. Between them, they have lead the Oxford Varsity blind tasting team three times to victory against Cambridge. Domen and Janice are both currently studying for their WSET Diploma and have both completed the WSET Educator training course. They post about wine under @DQPWines on twitter and instagram.
References
- Almenberg, J., & Dreber, A. (2011). When does the price affect the taste? Results from a wine experiment. Journal of Wine Economics, 6, 111-121.
- D’Alessandro, S. & Pecotish, A. (2013). Evaluation of wine by expert and novice consumers in the presence of variations in quality, brand, and country of origin cues. Food Quality and Preference, 28, 287-303.
- Li, Y., & Bardaji, I. (2016). A new wine superpower? An analysis of the Chinese wine industry. American Association of Wine Economists Working Paper, June 2016, 198.
- Mueller, S., & Szolnoki, G. (2010). The relative influence of packaging, labelling, branding and sensory attributes on liking and purchase intent: Consumers differ in their responsiveness. Food Quality and Preference, 21, 774-783.
- Rosenheck, D. (2017). Think wine connoisseurship is nonsense? Blind-tasting data suggest otherwise. The Economist, August 17th. Accessed from https://www.economist.com/blogs/graphicdetail/2017/05/daily-chart-11.
- Segal, J., Pol Roger UK Ltd, & Waugh, H. (2013). Red, Whites & Varsity Blues: 60 Years of the Oxford & Cambridge Blind Wine-Tasting Competition. London, UK: Pavilion Book