
By Mario Arturo Ruiz Estrada, Donghyun Park, and Anthony Chin
1. Introduction
Studies of wine industry performance have largely focused on derivation of key performance indicators and efficiency indicators. However, no two wine industries have similar operating environments, managerial competency, innovation, institutional set up, and government support. As such, comparing the wine industry performance of different countries would not be meaningful without greater transparency of data. Furthermore, the wine industry forms part of dynamic global market undergoing constant supply and demand shocks. The dynamic nature and mobility of production centers, from procurement of primary and intermediate inputs to production to distribution of final products, is constantly affecting the costs of wine producers and competition between them.
The wine industry does not exist within a vacuum. Therefore, measurement of wine industry performance should not occur in a vacuum. However, fundamental information such as efficiency and production cost rates is shrouded under commercial confidentiality. A wine industry may be efficient but not effective. Being effective is to serve the right markets at the right time, which efficiency indicators may fail to capture. That is, effectiveness is not just about efficiency alone. For example, easing access into wine industry when new technology is not readily available may affect effectiveness more than efficiency. Therefore, evaluating wine industry requires clear reference points.
Doing so allows wine industry operators an insight into what customers are looking for and constantly improve services to wine customers in different markets around the world. Producers, suppliers, sellers, shipping lines, freight companies are the key global wine supply chain players who influence warehousing costs, reliability, and safety of wines. Shipping lines focus on load factors, congestion of the wine industry, costs of operation, and environmental taxes.
The global wine supply chain players are concerned with multi-modal connectivity to the wine industry, access and egress times from the wine industry to custom procedures. Time sensitive wine cargo requires quick turnaround times, which only some wine industries are able to deliver. Wine industry effectiveness and performance is a complex issue subject to perception and subjective preferences but it is best measured from user perspectives which require the wine industry to reconcile production, externalities, productivity, service gaps, and different priorities. We offer an alternative approach to the study of wine industry performance measurement, an approach more suitable for a dynamic environment.
The rest of this paper is organized as follows. We first summarize the existing literature, and then we introduce the Wine Industry Network Evaluation model (WINE-Model). We apply the model to the wine industries of Spain, Italy, France, Greece, Chile, and Argentina, and report and discuss the results. We then conclude the paper.

The analysis of the wine industry performance has taken both quantitative and qualitative approaches.Here we propose the Wine Industry Performance Evaluation Model (WINE-Model) as an alternative analytical approach in the study of wine industry, specifically for measuring productivity. We follow the interesting research works of Balakrishnan and Pushpangadan (1994), Fernandez Olmos et al. (2010), Garcia et al. (2012), Crozet et al. (2012), and Mariani et al. (2012). However, while the four research papers provide different points of view about the wine industry issues from qualitative and quantitative perspectives, we recommend the use of a large number of variables in constructing the wine industry network evaluation model (WINE-Model).
Hence, the included variables will have the same level of importance and integrated into the same indicator and graphical space. Moreover, we try to capture many variables present in the dynamic interplay of wine industry productivity and factors such as light and heavy machinery industry, biotechnology industry, and other industries related to wine production. However, the wine industry network efficiency (WINE-Index) singles out a small subset of such variables, divides them into exogenous and endogenous variables, and assumes that everything other than those variables is exogenous.
Hence, we look at the problem from a more integrative analytical standpoint that considers the dynamic co-movement of all relevant variables. This co-movement is then represented in a multi-dimensional graph and subsequently, we compute a set of indices that allow policy makers to estimate wine industry network efficiency (WINE-Index) as an annual percentage of a country’s wine industry efficiency output, which in turn, can be computed from the country’s wine competitiveness estimates. In addition, the wine industry performance rate (∆Π) is based on a set of raw input data that are collected annually from the national wine production records, data which are subsequently transformed into an alternative set of variables.
Nine wine industry performance indicators are included in the model: (i) Training: Number of training sessions annually, (ii) physical condition: basic medical annual checkup per worker, (iii) years of experience: average years of working experience among all staff, (iv) ratio of local to foreign workers: we compare the percentage between local and foreign workers, (v) technological management: basic use of technology, (vi) incentives programs: allowance and commissions, (vii) salaries skills: time and amount of money, (viii) management system: centralized or des-centralized management systems, and (ix) environmental changes: climate changes, measured by temperature and rain levels.
These variables, observed annually, are then transformed into annual growth rates of change. From the mathematical perspective, wine industry performance rate (∆Π) is not a simple relationship between two variables (such as the endogenous variable and the exogenous variable) that are fixed at a specific time and space. Hence, the wine industry performance rate (∆Π) requires a multi-variable analytical framework, where no variable is isolated in the mathematical and graphical modeling.
The construction of the wine industry network efficiency (WINE-Index) varies from one country to another. It varies according to staple wine preferences, wine market size, geographical location, and probability of climate change, and finally, the statistical resources available in the country. In the construction of the wine industry network efficiency (WINE-Index), the implicit assumption is that it is impossible to predict or forecast any externality such as economic crisis or climate changes with accuracy based on a stable relationship between a single exogenous variable and a single endogenous variable.
We take view that the absence of non-quantitative variables can compromise measurement of wine industry performance. Therefore, we suggest that a wine industry performance model should take into consideration a wide range of factors, including unforeseen ones. These include factors such as climate changes, environmental factors, financial crisis, globalization, smuggling, and monopoly power. Such comprehensive analysis will allow for concrete policies that improve wine industry performance in the long run. However, all these factors are assumed to undergo steady transformation(s) through different historical stages of wine industry development.
We deploy the WINE-Model here to analyze how wine industry productivity rate, wine industry performance rate, wine cargo expansion rate, and wine industry technological change adaptability rate can affect directly WINE-Index performance, regardless of the wine industry size. The model allows us to quantify and analyze the WINE-Index rate. We employ a mathematical and graphs to analyze the wine industry performance and suggest a set of new indicators to evaluate the wine industry performance. Its advantage is flexible adaptability in analyzing performance without any restrictions. The model will test two following hypotheses:
- Wine industry productivity rate performance is directly and simultaneously connected to the efficient coordination of wine market openness, wine industry performance level, wine cargo expansion level, and wine industry adaptability to technological changes;
- The profit of any wine industry is dependent on how fast, smooth and flexible it is in utilizing human capital in adapting to new technological changes in the wine industry.
2. WINE-Model and the Performance of selected Major Wine Producers
The WINE-Model was applied initially to six large world producers of wine, namely Spain, Italy, France, Greece, Chile, and Argentina (see Table 1). The period of study is between 1970 and 2010, which was selected to evaluate if there is a strong linkage between wine industry productivity growth rate and four main variables of interest. The four variables are wine industry performance rate, wine industry productivity rate, wine cargo expansion rate, and adaptability of wine industry to technological change. The results show that wine industry productivity rate is directly dependent on efficient coordination of wine industry performance rate, wine industry productivity rate, wine cargo expansion rate, and adaptability rate to technological change. According to the WINE-Model results, France enjoys the highest wine industry productivity rate (see Table 1), followed by Spain and Italy (see Table 1), and Chile, Argentina, and Greece, which placed last. Greece shows a weaker wine industry performance rate, accompanied by slow wine cargo expansion, a low wine industry productivity rate, and slow adaptability rate to technological change (see Table 1).
In addition, the WINE-Model was evaluated by using the Wolfram Mathematica version 7. To do so, we input all equations together with a large amount of data. The main objective of running the WINE-Model with Mathematica Version 7 is to observe mathematically and graphically how the wine industry productivity rate evolution is directly and simultaneously connected to the efficient coordination of wine industry performance rate (ΔΠ), wine industry productivity rate (Π*), wine cargo expansion rate (Δϛ), and adaptability of wine industry to technological changes (ϕ). At the same time, the profit of any wine industry depends on how quickly, smoothly, and flexibly its human capital adapts to new technological shocks and changes.
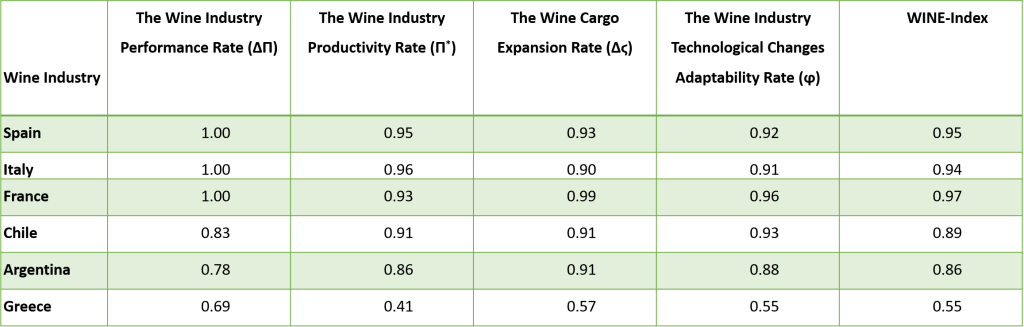
Source: Hellenic Republic Ministry of Rural Development and Food (2017); Ministerio de Agricultura Española (2017); Ministero Delle Politiche Agricole Alimentari e Forestali (2017); Ministere de’l Agriculture de’l Agroalimentaire (2017); Ministro de Agricultura Chileno (2017); Ministerio de Agricultura, Ganaderia, y Pesca Argentino (2017); The Wine Institute (2017); World Trade Organization (2017).
3. Conclusion
In this study, we incorporate wine industry performance, productivity level, wine cargo expansion, and adaptability of wine industry to technological change adaptability to evaluate wine industry performance. The wine industry performance evaluation model (WINE-Model) was proposed to evaluate how the above factors can directly affect the productivity rate and performance of the wine industry. The objective is to offer policy makers and researchers a different, more dynamic perspective in assessing the effect of changing factors such as international trade trends, technology shocks, or competition in evaluating the wine industry performance.
The versatility and adaptability of the WINE-Model is such that it can be applied to any production unit or a group of economic activity. It is not constrained by geographical area or development stage of the industry. It is thus simple, flexible, and versatile. In an era of globalization where structural changes take place in short cycles and production units constantly change location, the main advantage of the WINE-Model is the ability to capture and measure wine industry performance from a dynamic viewpoint.
The main conclusion from our analysis is that the key to maximizing wine industry productivity rate (Crozet, Head, and Mayer, 2012) is efficient coordination of wine market performance rate, wine industry productivity rate, rapid expansion of wine cargo, and adaptability of the wine industry to technological shocks. The second main finding is that wine industry productivity rate depends on how well human capital factor can adapt to new technologies and production systems.

Dr. Mario Arturo Ruiz Estrada is a Guatemalan academic, he is currently Senior Research Fellow at the Social Security Research Centre (SSRC) and Centre of Poverty and Development Studies (CPDS) in the Faculty of Economics and Administration (FEA) of the University of Malaya (UM), which he joined in April 2002. Prior to joining University of Malaya, he was a tenured senior lecturer at Universidad de San Carlos and Francisco Marroquin University at Guatemala. Dr. Mario Arturo Ruiz Estrada is an expert in economic modelling and policy modelling, and his main research fields are economic modelling, policy modelling, Econographicology, international trade, and development economics. His research, which has been published extensively in journals such as Journal of Policy Modeling, Disasters, Singapore Economic Review, Quality and Quantity, Panoeconomicus, Contemporary Economics, International Journal of East Asian Studies, Malaysian Journal of Sciences, International Journal of Economic Research, Peace-Defense Economics, Panoeconomicus, Asia-Pacific Development Journal, and others.
References
- Balakrishnan, P. and Pushpangadan, K. (1994). Total Factor-Productivity Growth in Manufacturing Industry: A Fresh Look. Economic and Political Weekly, 29(31), 2028-2035.
- Crozet, M., Head, K., and Mayer, T. (2012). Quality Sorting and Trade: Industry-Level Evidence for French Wine. The Review of Economic Studies, 79(2), 609-644.
- Fernandez Olmos, M. (2010). The Performance Implications of grow or buy Decisions in the Wine Industry. Food Policy, 35(3), 256-264.
- Garcia, F., Marchetta, M., Camargo, M., Morel, L., and Forradellas, R. (2012). A Framework to Measuring Logistic Performance in the Wine Industry. International Journal of Production Economics, 135(1), 284-298.
- Hellenic Republic Ministry of Rural Development and Food. (2017). Wine statistics section. Retrieved from http://www.minagric.gr/index.php/en/
- Mariani, A., Pomarici, E., and Boatto, V. (2012). The International Wine Trade: Recent Trends and Critical Issues. Wine Economics and Policy, 1(1), 24-40.
- Ministerio de Agricultura Española (2017). Wine statistics section. Retrieved from http://www.magrama.gob.es/es/
- Ministero Delle Politiche Agricole Alimentari e Forestali. (2017). Wine statistics section. Retrieved from http://www.politicheagricole.it/flex/cm/pages/ServeBLOB.php/L/IT/IDPagina/202
- Ministere de’l Agriculture de’l Agroalimentaire. (2017). Wine statistics section. Retrieved from http://agriculture.gouv.fr/
- Ministro de Agricultura Chileno. (2017). Wine statistics section. Retrieved from http://www.minagri.gob.cl/
- Ministerio de Agricultura, Ganaderia, y Pesca Argentino. (2017). Wine statistics section. Retrieved from http://www.minagri.gob.ar/site/index.php
- The Wine Institute. (2017). Wine statistics section. Retrieved from http://www.wineinstitute.org/resources/statistics
- World Trade Organization. (2017). Wine statistics section. Retrieved from www.wto.org
[…] Science & Wine: Measuring Wine Industry Efficiency with Wine Industry Network Evaluation Model (… […]